本讲涵盖以下模块:
银行资产负债久期缺口分析;
含权债券的有效久期;
使用 AkShare 获取中国国债收益率并计算久期。
所有代码均可直接在 VS Code 的 Jupyter Notebook 中运行。
利率风险管理与久期缺口分析
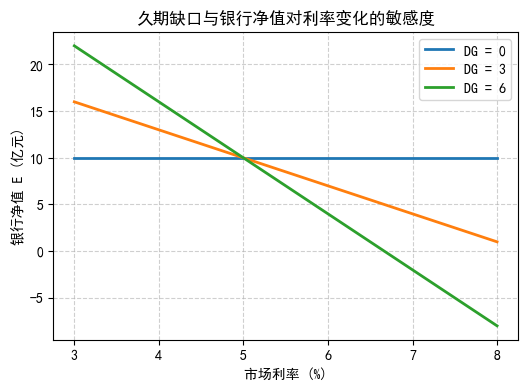
本节演示银行如何利用久期缺口 (DG) 衡量净值对利率变化的敏感度,并通过可视化展示不同 DG 水平下净值的变动。
import numpy as npimport matplotlib.pyplot as plt# 支持中文 'font.sans-serif' ] = ['SimHei' ]'axes.unicode_minus' ] = False = 100 , 90 = A - L= [0 , 3 , 6 ]= np.linspace(0.03 , 0.08 , 101 )= {}for DG in DG_list:= - DG * (r - 0.05 ) * (A/ E0)= E0 * (1 + dE)= E= (6 ,4 ))for DG, E in results.items():* 100 , E, lw= 2 , label= f'DG = { DG} ' )'久期缺口与银行净值对利率变化的敏感度' )'市场利率 (%)' )'银行净值 E (亿元)' )True , linestyle= '--' , alpha= 0.6 )print ('当利率上升 1% 时:' )for DG in DG_list:= - DG * 0.01 * (A/ E0)print (f' DG= { DG} → 净值变化约 { dE* 100 :.1f} %' )
当利率上升 1% 时:
  DG=0 → 净值变化约 0.0%
  DG=3 → 净值变化约 -30.0%
  DG=6 → 净值变化约 -60.0%
含权债券的有效久期计算
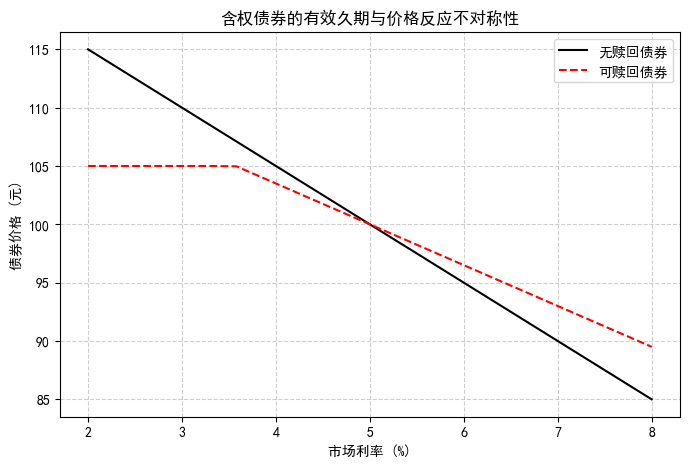
有效久期 \(D_{Eff}\) 衡量含权债券价格对利率变化的平均敏感度。由于发行人可能在利率下降时提前赎回,含权债券的价格变化往往不对称。
= 100 , 0.01 = 105 , 95 = (P_minus - P_plus) / (2 * P0 * Δy)print (f'有效久期 D_eff = { D_eff:.2f} 年' )print ('含权债券的有效久期低于普通债券, 因为价格对利率变化的反应不对称。' )= np.linspace(0.02 , 0.08 , 20 )= 100 * (1 - 5 * (y - 0.05 ))= 100 * (1 - 3.5 * (y - 0.05 ))> 105 ] = 105 = (8 ,5 ))* 100 , P_no_option, label= '无赎回债券' , color= 'black' )* 100 , P_callable, label= '可赎回债券' , color= 'red' , linestyle= '--' )'市场利率 (%)' )'债券价格 (元)' )'含权债券的有效久期与价格反应不对称性' )True , linestyle= '--' , alpha= 0.6 )
有效久期 D_eff = 5.00 年
含权债券的有效久期低于普通债券, 因为价格对利率变化的反应不对称。
使用 AkShare 获取中国国债收益率并计算久期
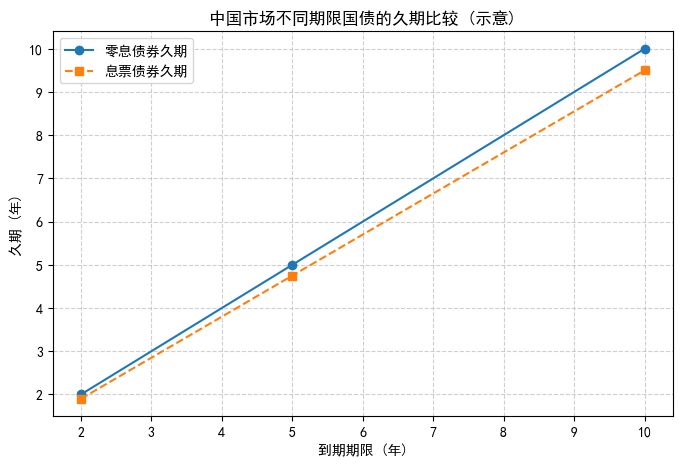
本节演示如何使用 AkShare 获取中国国债收益率数据,并计算不同期限债券的久期示意。
import akshare as aktry := ak.bond_zh_us_rate()print ('数据示例:' )print (yield_curve.head())except Exception as e:print ('未能成功访问 AkShare 接口, 请检查网络或数据源:' , e)= np.array([2 , 5 , 10 ])= np.array([0.025 , 0.03 , 0.035 ])= maturity= maturity - 0.5 * (maturity/ 10 )= (8 ,5 ))'o-' , label= '零息债券久期' )'s--' , label= '息票债券久期' )'中国市场不同期限国债的久期比较 (示意)' )'到期期限 (年)' )'久期 (年)' )True , linestyle= '--' , alpha= 0.6 )print ('结果说明: 零息债券久期等于到期时间, 而息票债券久期较短, 因为提前收到现金流。' )
数据示例:
           日期  中国国债收益率2年  中国国债收益率5年  中国国债收益率10年  中国国债收益率30年  中国国债收益率10年-2年  \
0  1990-12-19        NaN        NaN         NaN         NaN            NaN
1  1990-12-20        NaN        NaN         NaN         NaN            NaN
2  1990-12-21        NaN        NaN         NaN         NaN            NaN
3  1990-12-24        NaN        NaN         NaN         NaN            NaN
4  1990-12-26        NaN        NaN         NaN         NaN            NaN

   中国GDP年增率  美国国债收益率2年  美国国债收益率5年  美国国债收益率10年  美国国债收益率30年  美国国债收益率10年-2年  \
0       NaN       7.21       7.64        8.00        8.19           0.79
1       NaN       7.25       7.67        8.05        8.22           0.80
2       NaN       7.30       7.75        8.11        8.28           0.81
3       NaN       7.35       7.84        8.20        8.36           0.85
4       NaN       7.27       7.78        8.15        8.30           0.88

   美国GDP年增率
0       NaN
1       NaN
2       NaN
3       NaN
4       NaN
结果说明: 零息债券久期等于到期时间, 而息票债券久期较短, 因为提前收到现金流。